AGLAOS PORTFOLIO DASHBOARD
Overview
The Aglaos Strategic Portfolio is an actively managed, core-satellite investment model designed to deliver long-term capital growth through disciplined equity selection and diversified fixed income exposure.
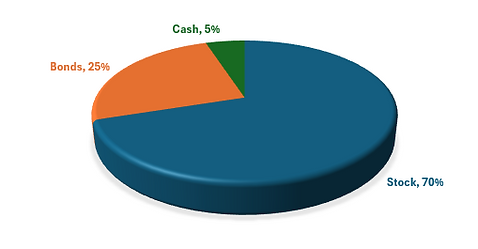
The equity sleeve (representing 70% of the portfolio) combines a passive core of broad US and international market ETFs with an active satellite of 30 large-cap US stocks selected through fundamental valuation analysis. Stock selection prioritizes undervalued and fairly valued securities relative to their implied market equilibrium returns, with position weights anchored to the S&P 500 index weights as a risk floor.
The fixed income sleeve (representing 25% of the portfolio) is diversified across duration, credit quality, and geography, spanning US investment grade, high yield, and international bonds. The remaining 5% is held in short-term Treasury ETFs as a cash equivalent, providing liquidity and downside buffer.
Download the policy and holdings statement.
Portfolio Performance
Period | Portfolio Return | Benchmark Return |
|---|---|---|
1-Day | 0.87% | 0.78% |
Inception to Date | -1.78% | -0.39% |
Portfolio Detail
Portfolio Inception Date | Metric Value |
|---|---|
Inception Date | 5/29/2026 |
Number of Holdings | 37 |
Annualized Volatility | 14.60% |
Sharpe ratio | 0.9 |
Beta | 1.14 |
Region Allocation
Asset Class Allocation

Main Asset Class | Category | Holding Type | Number of Holdings | Portfolio Weight |
|---|---|---|---|---|
Equities | US Large Cap Stocks | Stock | 30 | 40% |
Equities | US Total Market | ETF | 1 | 10% |
Equities | Developed Market ex-US | ETF | 1 | 10% |
Equities | US Large Cap Stock Fund | ETF | 1 | 10% |
Fixed Income | US Investment Grade Bonds | ETF | 1 | 15% |
Fixed Income | Developed Market ex-US Investment Grade Bonds | ETF | 1 | 5% |
Fixed Income | US High Yield Bonds | ETF | 1 | 5% |
Cash | Cash | Cash | 1 | 5% |
Portfolio Sector Allocation

Large Cap Stock Sector Allocation
Sector | Portfolio Weight | S&P 500 Weight | Deviation |
|---|---|---|---|
Information Technology | 54.68%
| 31.00%
| +23.68%
|
Communication Services
| 12.81% | 10.10% | +2.71% |
Financials
| 9.85% | 13.10% | -3.25% |
Consumer Discretionary
| 9.28% | 10.70% | -1.42% |
Health Care
| 7.17% | 12.10% | -4.93% |
Consumer Staples | 6.20% | 5.80% | +0.40% |
Weighted Average Duration
5.6 yrs
Weighted Average Yield
4.8%
Weighted Average Expense Ratio
0.07%
Credit Quality
US Government -- 41.5%
AAA -- 7.1%
AA -- 5.7%
A -- 14.6%
BBB -- 22.7%
BB_&_Below -- 8.4%